Key points
– CoreLogic data shows average home prices rose 0.3% in February, after a brief three-month downturn of just 0.4%.
– The upswing came in anticipation of, and then confirmation of, an RBA rate cut which boosted buyer confidence.
– Annual growth in rents slowed to 4.1%yoy, the slowest since 2021. Poor rental affordability leading to rising average household sizes and easing student arrivals are weighing on demand for rental property.
– Australia continues to have a chronic shortage of homes, estimated to be around 200,000 dwellings and possibly as high as 300,000. This partly explains the resilience of home prices despite the rise in mortgage rates since May 2022.
– RBA rate cuts are expected to drive a modest upswing in average prices this year. However, while there is still a big housing shortfall in Australia, the upswing will be starting from a point of still poor affordability, interest rates are only likely to fall modestly, and population growth is slowing.
– After 4.9% growth last year, we expect average property prices to rise around 3% this year.

Home prices turned back up again in February
After a brief downswing, national average property prices hooked back up in February, reflecting the anticipation and then reality of the RBA starting to cut rates. Most cities saw gains between 0.2%mom to 0.4%mom with the recent losers of Melbourne, Hobart, Canberra and Sydney picking up as the booming cities of the last two years – Brisbane, Adelaide and Perth – continue to slow as poor affordability impacts them.
Australian dwelling price growth
|
February, % change |
Annual % change |
% change from peak |
Median value |
|
| Sydney |
0.3 |
1.1 |
-1.6 |
$1,186,459 |
| Melbourne |
0.4 |
-3.2 |
-6.4 |
$772,561 |
| Brisbane |
0.2 |
9.7 |
New high |
$894,425 |
| Adelaide |
0.3 |
11.9 |
New high |
$822,201 |
| Perth |
0.3 |
14.3 |
New high |
$807,933 |
| Hobart |
0.4 |
-0.3 |
-11.9 |
$661,544 |
| Darwin |
-0.1 |
1.5 |
-5.9 |
$506,591 |
| Canberra |
0.2 |
-0.9 |
-7.1 |
$846,955 |
| Capital avg |
0.3 |
3.2 |
-0.6 |
$896,613 |
| Regional avg |
0.4 |
5.5 |
New high |
$661,966 |
| National avg |
0.3 |
3.8 |
-0.1 |
$815,912 |
Source: CoreLogic
The downswing just saw a 0.4% fall in national average prices spread over 3 months, with falls in Hobart, Canberra, Melbourne, Darwin and Sydney partly offset by continued gains in Brisbane, Adelaide, Perth and regional areas.
Average capital city home prices
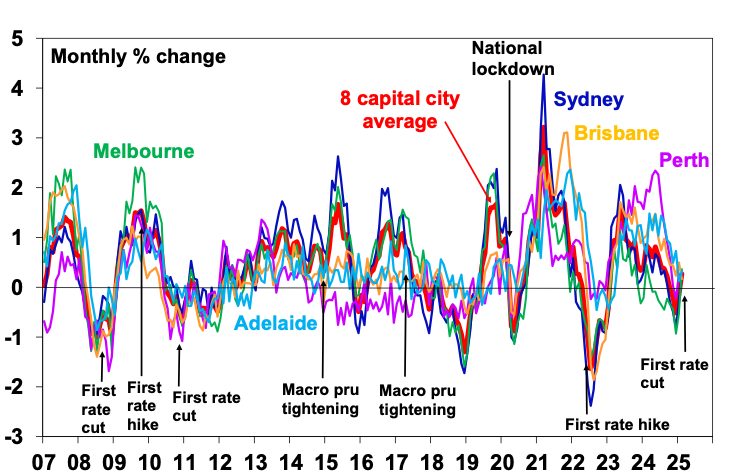
Source: CoreLogic, AMP
Expect further gains in average property prices
Further gains are likely as interest rates fall further and the shortage of property remains, provided unemployment doesn’t rise too far. The upswing is likely to be more apparent through the second half as we see more rate cuts.
- We expect three more RBA 0.25% rate cuts by early next year – in May, August and February. Lower rates are positive for property because they take pressure off existing homeowners who may have been struggling with their mortgages leading to less distressed listings and as they increase the amount a borrower can borrow from a bank and hence pay for a property which supports demand. Buyers know this and so rate cuts also provide a boost to buyer sentiment and that is what we have mostly seen in improved auction clearances and now higher prices so far this year. Roughly speaking the 0.25% rate cut when passed on to variable mortgage rates will add about $9000 to how much a buyer on average earnings can borrow which along with three further rate cuts into early next year will drive a significant increase in the capacity of buyers to pay for a property. See the next chart which also allows for wages growth over the year ahead.
Australian home pries versus capacity to pay
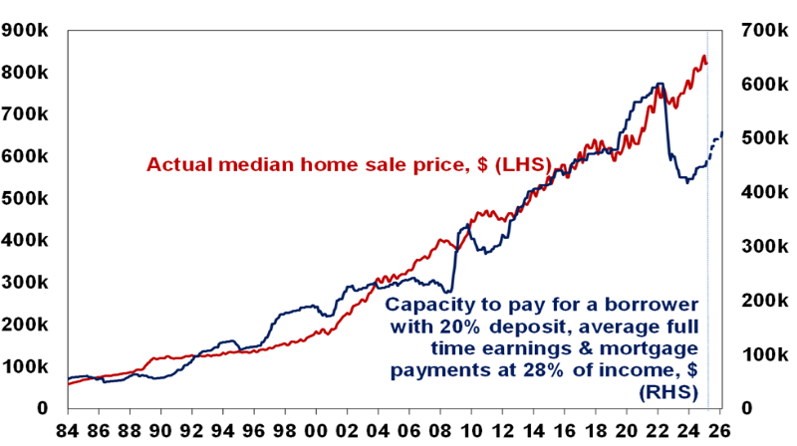
Source: RBA, CoreLogic, AMP
- The rate cuts are also occurring against a backdrop of an ongoing housing shortage which we have seen over the last few years provides a source of support for prices. We estimate the accumulated housing shortfall to be around 200,000 dwellings at least, and possibly as high as 300,000 dwellings. It is likely to remain significant for a while yet as building approvals running just above 180,000 dwellings a year indicate that housing completions are likely to run below government objectives for 240,000 homes a year (or 1.2 million over five years) for some time to come and may never reach that objective.
The accumulated shortfall of housing in Australia
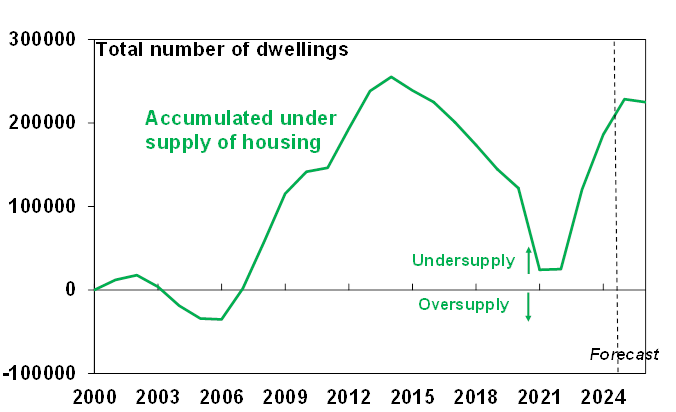
Source: ABS, AMP
Modest downswing = likely modest upswing
Just as the downswing was mild the upswing is likely to be too. This is because it’s starting from a point of still poor affordability, interest rates are only likely to fall modestly, and population growth is slowing.
- Despite the 13 rate hikes between May 2022 and November 2023 average home prices just had a flick of the top into their January low.
Australian residential property prices since 1990
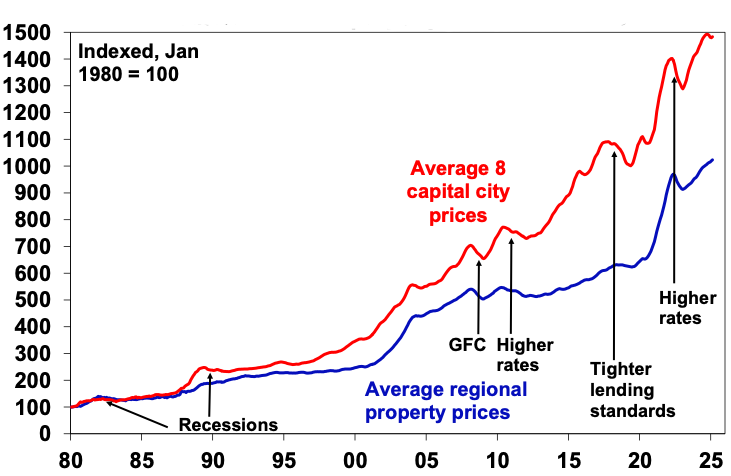
Source: CoreLogic, AMP
- This means housing affordability remains very poor without the usual improvement rate cuts can drive via lower prices. This is evident in the ratio of home prices to wages & incomes being around record levels.
Ratio of home prices to wages and incomes
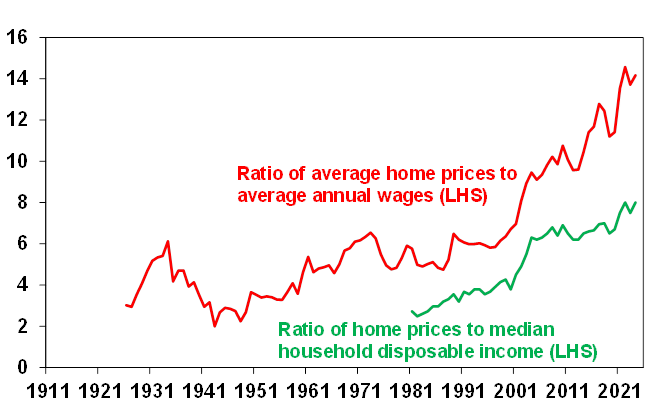
Source: ABS, CoreLogic, AMP
- While interest rates are likely to fall further, in the absence of recession and much higher unemployment we only expect about 4 or maybe 5 rate cuts in total, taking the cash rate back to a low of around 3.1 to 3.35% next year and mortgage rates to around 5%. This will only partially reverse the 13 rate hikes between May 2022 to November 2023 and leave mortgage rates well above their record lows of around 2 to 3%. As such, the buying capacity of home buyers is expected to improve but remain well below the levels seen in 2021-22. See the second chart above. This will limit the upside in property prices. And with a large gap likely to remain between average prices and the capacity of borrowers to pay for a new home leaves a downside risk hanging over the market if something goes wrong – like a sharp rise in unemployment.
- Slower population growth, reflecting a crackdown on student visas and increasing departures as the post pandemic surge in long term visas expires, will likely lead to a further easing in the rental market which will help take some pressure off the home buyer market.
- Divergence in the property market is likely to remain, but in a reversal of the last year with the recent strong cities (Perth, Adelaide and Brisbane) slowing further on the back of poor affordability as they are now more expensive than Melbourne, partly offsetting a further recovery in Melbourne, Hobart, Canberra and Sydney.
So just as the downswing in property prices was modest, the upswing is likely to be modest too. After 4.9% growth last year, we expect average property prices to rise around 3% this year with the upswing becoming more noticeable in the second half.
Auction clearance rates are up from their lows late last year but are running around average levels or a bit below consistent with a gradual recovery in the property market.
Auction clearance rates
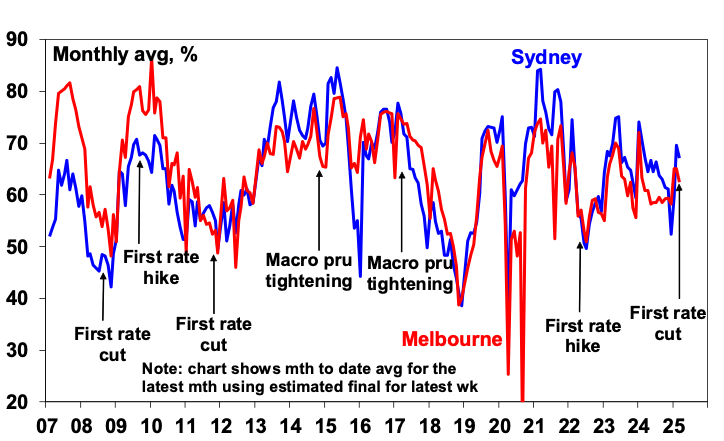
Source: Domain, AMP
What to watch?
The key things to watch will be interest rates, unemployment and population growth. For example, a return to RBA rate hikes or less cuts than we are forecasting, a sharply rising trend in unemployment and a sharp slowing in net migration could result in a resumption of property price falls reflecting the divergence between home buyers’ capacity to pay and current home price levels. On the flipside a faster fall in rates on the back of weaker than expected inflation could drive a stronger upswing in property prices. And of course, Australian home prices have had a tendency to surprise economists (like me) and many others on the upside over the last few decades.
Dr Shane Oliver – Head of Investment Strategy and Chief Economist, AMP
Important note: While every care has been taken in the preparation of this document, AMP Capital Investors Limited (ABN 59 001 777 591, AFSL 232497) and AMP Capital Funds Management Limited (ABN 15 159 557 721, AFSL 426455) make no representations or warranties as to the accuracy or completeness of any statement in it including, without limitation, any forecasts. Past performance is not a reliable indicator of future performance. This document has been prepared for the purpose of providing general information, without taking account of any particular investor’s objectives, financial situation or needs. An investor should, before making any investment decisions, consider the appropriateness of the information in this document, and seek professional advice, having regard to the investor’s objectives, financial situation and needs. This document is solely for the use of the party to whom it is provided.