Matt Griffin
Over the past month we have seen a number of companies raise fresh capital in order to provide their businesses with sufficient liquidity to ride out the current COVID-19 related disruptions. This period has reminded us of the market coming out of the Global Financial Crisis (GFC) in 2009, where a large number of companies needed to recapitalise their balance sheets and some investors willing to participate have made very good returns. While we suspect the current window for these raisings may be shorter lived, in our view it has been an alpha rich opportunity for active managers.

The statistics since late March
-
36 small cap companies have completed capital raisings
-
A total of $6.1bn has been raised by small caps
-
The average discount has been 20.3%
-
The average gain vs placement price is 15.7%
-
Only 5 of the 36 companies are trading below their placement price
Above data is for the period 18/3/20 to 1/5/20. Note that all returns are relative to the Small Cap index. Source: AMP Capital, Factset
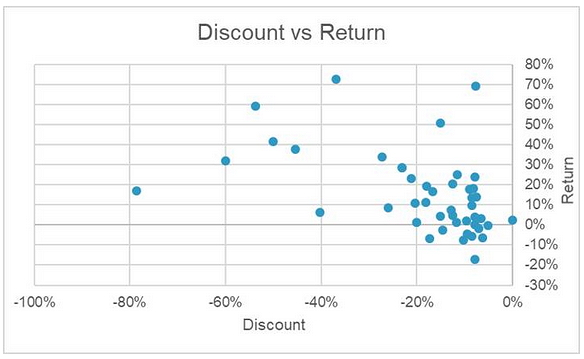
There has been a large range of returns on offer, with some top performers recording a 73% gain, a large number of stocks in the +10-40% range, and a handful which have underperformed the market. While the average discount has been around 20%, the range has been considerably wider.1
The chart below shows the relationship between discounts and returns, and it is interesting to note that every small cap company which has conducted a raising at a discount greater than the 20% average in March and April is showing a positive return.
By our analysis, the consistent theme among the winners has been the re-rating of companies that have faced severe revenue disruptions coupled with high debt levels, as the market looks through to normality returning with these companies now having sufficient liquidity in place to cross this bridge. The poor performers have been companies that have surprised with weaker than expected trading updates and those that may face structural issues going forward.

Source: AMP Capital, Factset. Data as at 1/5/20
How we approach these raisings
In general, recapitalisation or liquidity-driven capital raisings can fit our process quite well – prior to a raising these companies are usually trading on depressed valuations and have a very high risk score given the balance sheet risk. By raising money, we are therefore able to invest in companies with a good earnings based valuation score, and a vastly improved risk score given the enhanced liquidity and balance sheet profile of the company.
The AMP Capital Australian Emerging Companies fund has participated in a number of these recent capital raisings – a few of these have been in companies we have existing positions in, one that we intend to make a permanent position, and some in stocks that we have already sold or expect to sell shortly.
Importantly, all of these placements over March and April have contributed positively to fund performance to date. And while this will lead to elevated turnover for this period, the risk-reward equation on these placements has been stacked in our favour, they fit our process, and the alpha generated has been material.
Capital raising performance
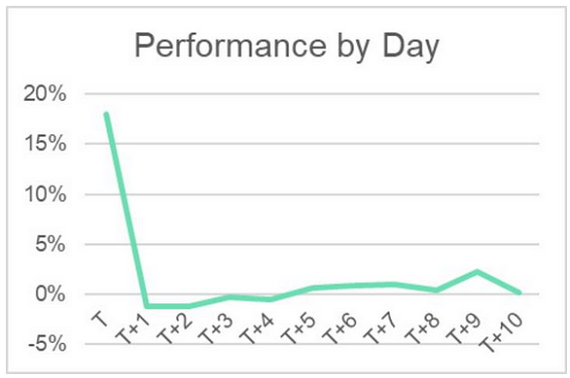
Within the 45 market-wide capital raisings that have taken place recently, we have observed a couple of interesting points relating to how stocks perform post-raising. Firstly, in the very short term, all the return for investors is made on the first day the stock resumes trading (point ‘T’ in the chart below). Performance then usually dips slightly as the new shares settle (generally two to four days later) and short-term holders looking for a quick profit exit the stock. See below graph.

Source: AMP Capital, Factset. Data as at 1/5/20
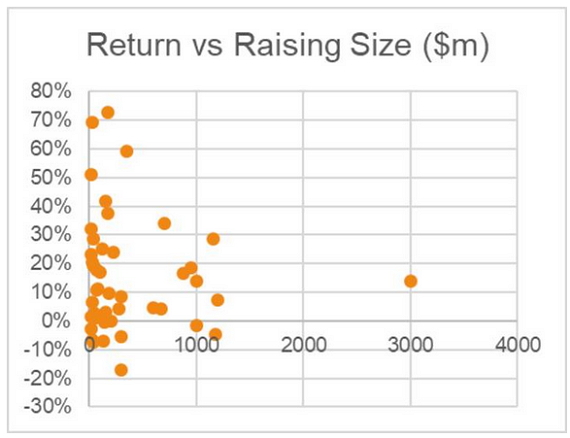
In addition, the smaller the size of the raising the greater the dispersion in performance. This certainly allows for some excellent returns but also raises the risk of substantial losses. In this environment, we believe small cap funds which conduct bottom-up research on companies are well positioned to capture the potential performance on offer. See below graph.

Source: AMP Capital, Factset. Data as at 1/5/20
1 Sources: AMP Capital, Factset
Author: Matt Griffin, Co-portfolio Manager, Small Caps, Sydney, Australia
Source: AMP Capital 13 May 2020
Important notes: While every care has been taken in the preparation of this article, AMP Capital Investors Limited (ABN 59 001 777 591, AFSL 232497) and AMP Capital Funds Management Limited (ABN 15 159 557 721, AFSL 426455) (AMP Capital) makes no representations or warranties as to the accuracy or completeness of any statement in it including, without limitation, any forecasts. Past performance is not a reliable indicator of future performance. This article has been prepared for the purpose of providing general information, without taking account of any particular investor’s objectives, financial situation or needs. An investor should, before making any investment decisions, consider the appropriateness of the information in this article, and seek professional advice, having regard to the investor’s objectives, financial situation and needs. This article is solely for the use of the party to whom it is provided and must not be provided to any other person or entity without the express written consent of AMP Capital.
